Automatic data fetching directly from the Reservanto booking system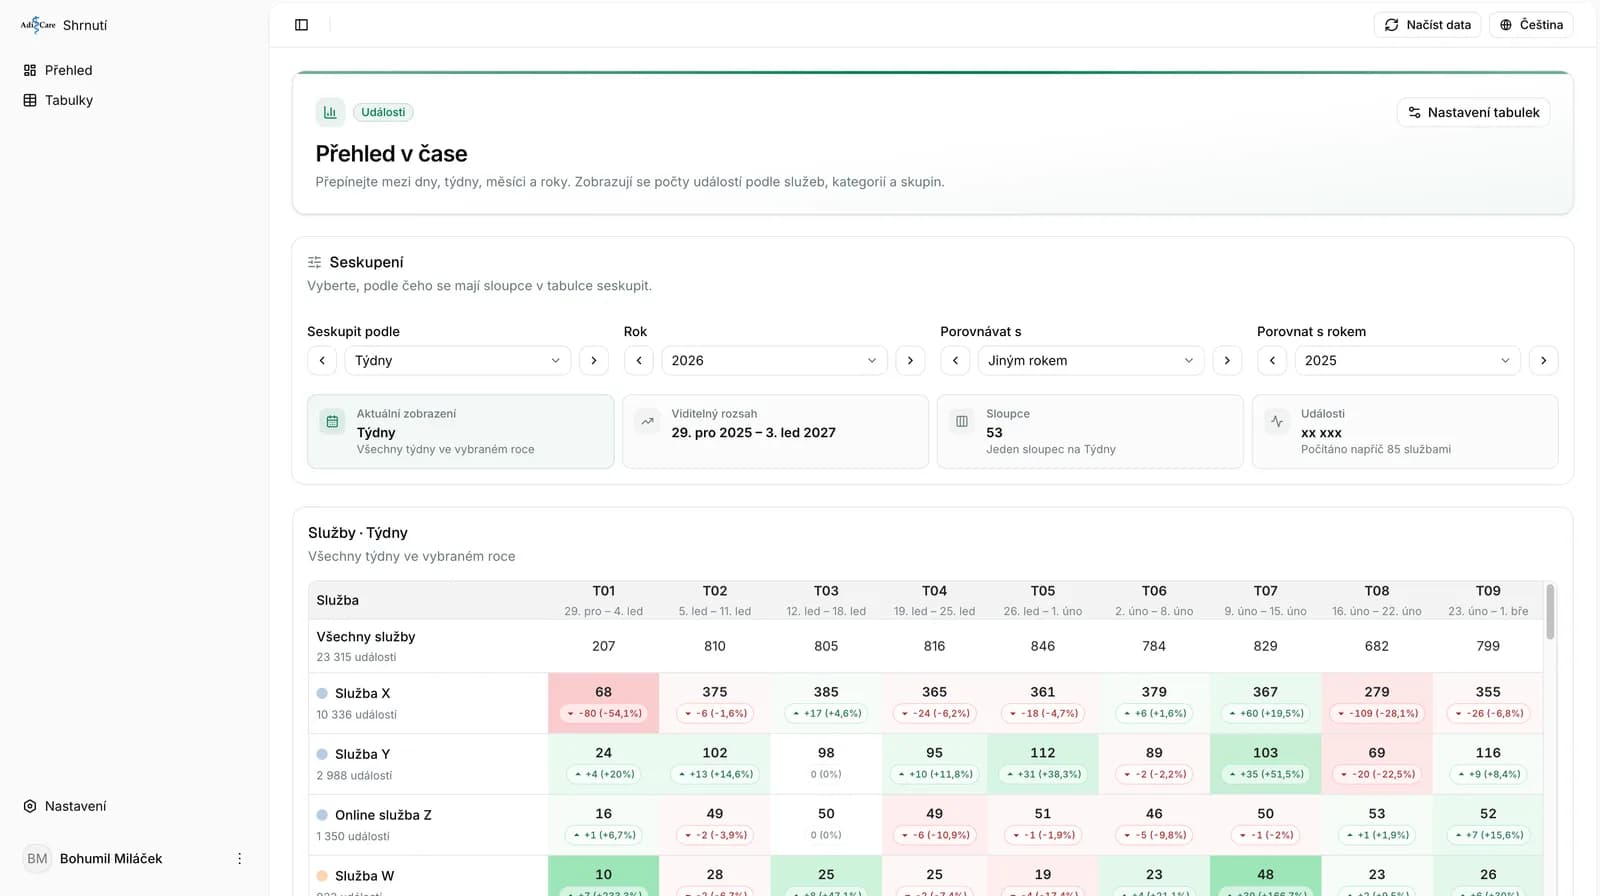
AdiCare is a clinic with several locations, dozens of services and therapists, managing its bookings in Reservanto. But Reservanto is built mainly for making the booking itself — not for giving management a quick view of how individual services, categories or locations are trending over time. That's exactly the gap we needed to fill.
After clicking the "Load data" button, the app connects to Reservanto on its own and fetches up-to-date data on both past and upcoming events. On the main Overview Over Time screen, you simply switch between days, weeks, months and years and watch event counts by service, category and category group. Next to every number you immediately see how it compares to the previous period or the same period a year earlier — both as a color and as a percentage.
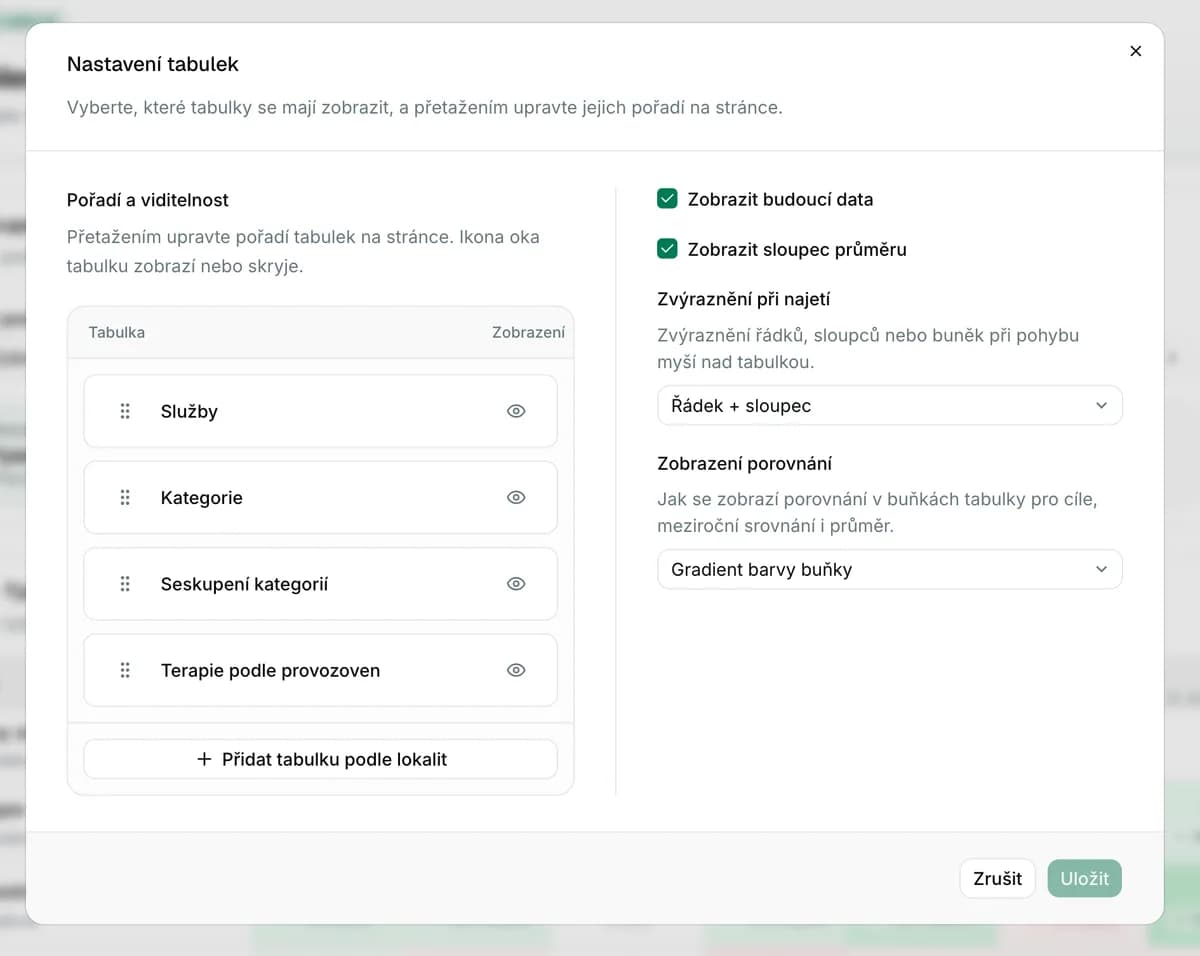
Since everyone at AdiCare works with the data differently, we gave users full control over what they see and how. In the table settings, they can drag tables into any order, show or hide individual tables, and turn on extra columns and behaviors:
Table order and visibility – drag services, categories, category groups and location tables into whichever order matters to you first.
Showing future data and an average column – adds planned bookings and the average value for the selected period right next to the table.
Hover highlighting – the row, column, or both light up as you move the mouse over the table, making the data much easier to scan.
Comparison display – year-over-year and target comparisons can be shown as a colored cell gradient or as a plain number, whichever a given user finds easier to read.
Data can also be freely grouped and color-coded — individual services, service categories and their higher-level groupings each get their own color, so you instantly recognize the type of event in the overview. The same applies to city and location groups, whenever you need to compare performance across sites.
Users get quick access to management directly from the top bar — one click takes them to Reservanto services, categories, category groupings, therapists, table settings, city groups, the Reservanto connection itself, data synchronization, and user and permission management. At the same time, every user can tailor their own overview settings without affecting what their colleagues see.
The result is a tool that turns raw booking data into a clear picture of how the clinic is doing within seconds — with no manual recalculating in Excel required. We keep developing the app as AdiCare's needs evolve, and we'd be happy to build a similarly "data-tailored" solution for your business too.